-
A
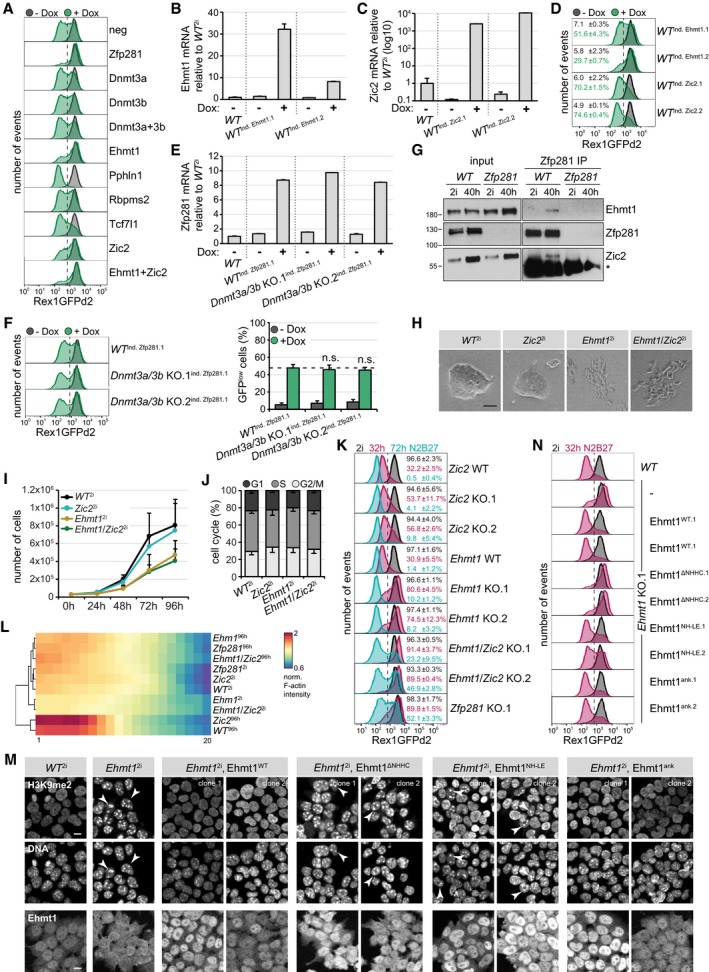
Representative flow cytometry profiles of Zfp281‐inducible RGd2 ESCs transfected with indicated siRNAs after 32 h in 2i and in the presence (green) or absence (black) of Dox.
-
B, C
FC Ehmt1 (B) and Zic2 (C) transcription relative to untreated WT
2i cells in indicated ESC clones after 32 h in 2i in the presence or absence of Dox. Average and SD of two technical replicates.
-
D
Representative flow cytometry profiles of RGd2 ESCs with conditional Ehmt1 and Zic2 expression after 32 h in 2i and in the presence (green) or absence (black) of Dox. Numbers are the average and SD of GFPlow cells in two experiments.
-
E
Zfp281 transcription relative to untreated WT
2i cells in indicated ESC clones after 32 h in 2i in the presence or absence of Dox. Average and SD of two technical replicates.
-
F
Representative flow cytometry profiles of Dnmt3a/3b compound KO RGd2 ESCs with conditional Zfp281 expression after 32 h in 2i and in the presence (green) or absence (black) of Dox. Significance was determined using a Wilcoxon–Mann–Whitney rank sum test compared to WT
ind. Zfp281.1 Dox‐treated cells. Not significant (n.s.) ≥ 0.05. Numbers are the average and SD of GFPlow cells in four experiments.
-
G
Whole‐cell lysate Zfp281 IPs in WT and Zfp281 KO cells in 2i or 40 h after 2i withdrawal, and probed for indicated proteins. Input (left) and Zfp281 IP (right). (*) Ig heavy chain.
-
H–J
Cell morphologies (H), growth curves (I), and cell cycle analyses using propidium iodide staining (J) of indicated genotypes in 2i. Average and SD of three experiments (I, J). Scale bar is 50 μm (H).
-
K
Representative flow cytometry profiles of indicated genotypes in 2i, and after 32 and 72 h of 2i withdrawal. Numbers are the average and SD of GFPhigh cells in two experiments.
-
L
Quantification and hierarchical clustering of normalized F‐actin intensity in 20 concentric rings (from center to circumference) in spheroids derived from ESCs with indicated genotypes in 2i or N2B27 for 4 days. Intensity is color‐coded and illustrates central F‐actin accumulation and, hence, polarization of WT and Zic2 KO cells during differentiation.
-
M
Representative immunofluorescence staining of WT or Ehmt1 KO ESCs expressing the indicated transgenes. Top: H3K9me2 and DAPI. Bottom: Ehmt1. Co‐localization of H3K9me2 with DAPI‐rich speckles in Ehmt1
2i cells expressing no transgene, the ∆NHHC, or NH‐LE alleles is indicated by arrowheads. Please note the absence of nuclear Ehmt1 staining in Ehmt1
2i cells and restoration by Ehmt1 transgenes. Scale bar is 10 μm.
-
N
Representative flow cytometry profiles of indicated genotypes in 2i and 32 h after 2i withdrawal.

