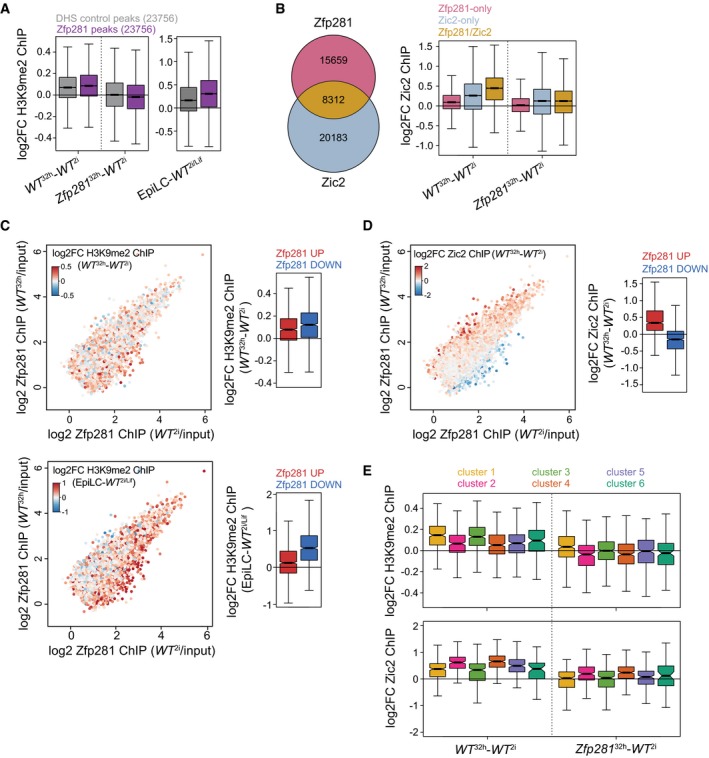
Figure 7. Zfp281 engages with Ehmt1 and Zic2 at developmental CREs.

-
AH3K9me2 ChIP log2FC between indicated cell states and genotypes at 10‐kb windows surrounding Zfp281‐bound (purple) or matching DNase‐hypersensitive site (DHS) control peaks (gray). Boxes as in Fig 3C for 23,756 datapoints each.
-
BOverlap of Zfp281 and Zic2 ChIP peaks (left) and Zic2 ChIP log2FC between specified cell states and genotypes at indicated peak subsets (right). Boxes as in Fig 3C for 15,659 (Zfp281‐only), 20,183 (Zic2‐only), and 8,312 (Zfp281/Zic2) datapoints.
-
C, DSame as in Fig 3F. Coloring is according to H3K9me2 ChIP log2FC between WT 32 h and WT 2i cells (C, top left) and between EpiLCs and WT 2i/Lif cells (C, bottom left) at Zfp281 peaks extended to 10‐kb windows, and according to Zic2 ChIP log2FC between WT 32 h and WT 2i cells (D, left). Quantification of corresponding ChIP changes at top 1,000 Zfp281 peaks with increased (red) or decreased (blue) Zfp281 binding during ESC differentiation (right). Boxes and number of datapoints as in Fig 3F.
-
EH3K9me2 (top) and Zic2 (bottom) ChIP log2FC between indicated cell states and genotypes at all Zfp281 peaks extended to 10‐kb windows (top) or Zfp281/Zic2 co‐bound peaks (bottom) associated with nearest TSSs of cluster 1–6 genes. Boxes and number of datapoints as in Fig 3C.
