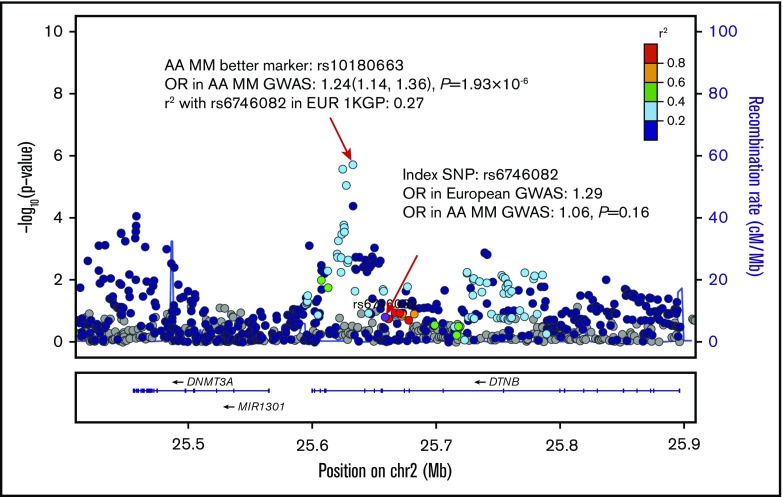
Figure 2.
Regional association plot of the 2p23.3 risk region (25.4-25.9 Mb) in persons of AA. SNPs are plotted by position (x-axis) and −log10P value (y-axis). Linkage disequilibriums are estimated from the EUR population in phase 3 1KGP using r2 statistics. The index SNP (bottom red arrow to purple circle) is rs6746082. The surrounding SNPs are colored to indicate pairwise correlation with the index SNP. The most associated SNP in the AA population in this region is rs10180663 (top red arrow).

