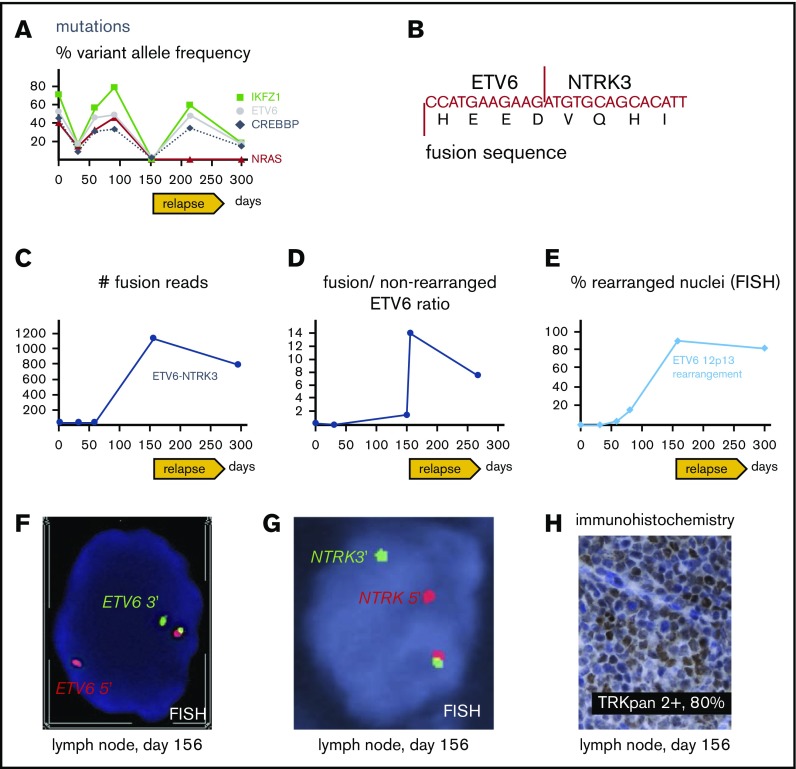
Figure 3.
Molecular pathology results. (A) Targeted next-generation sequencing of DNA from bone marrow aspirates with allelic frequency of pathogenic mutations. (B) Sequence of ETV6-NTRK3 transcript revealed with the fusion assay; for more detailed information, see supplemental Figure 1. (C) Number of unique ETV6-NTRK3 fusion reads in bone marrow aspirates (days 1, 32, 59, 295) and lymph node (day 156). (D) Ratio of fusion transcripts (ETV6 exon 4-NTRK3 exon 15) over wild-type transcript (ETV6 exon 4-ETV6 exon 5) from bone marrow aspirates (days 1, 32, 150, 266) and lymph node (day 156). (E) FISH of bone marrow aspirates (day 1, 32, 59, 80, 295) and lymph node (day 156). (F) FISH from lymph node showing break apart of 5′ (red) and 3′ (green) ETV6 probes revealing rearrangement as split-apart red and green signals as well the normal locus (unseparated red-green pair with yellow overlap). Magnification ×100. (G) FISH from lymph node showing break apart of 5′ (red) and 3′ (green) probes recognizing regions upstream and downstream of NTRK3, respectively; rearrangement resulting in split-apart red and green signals as well the normal locus (unseparated pair with yellow overlap). Magnification ×100. (H) Immunohistochemical stain revealing aberrant expression of TRK in lymph node. Magnification ×40. (A-H) Days refer to time from diagnosis.

