Figure 2.
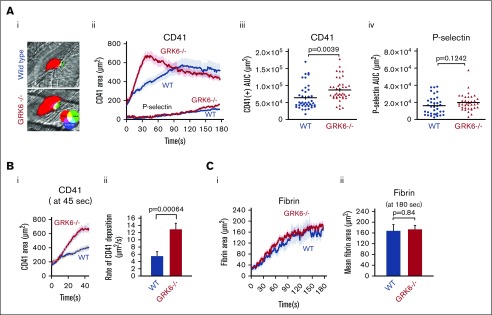
Increased platelet accumulation in response to hemostatic injury. (A) Representative images of hemostatic plugs formed in WT and GRK6−/− mice 1 minute after injury (Ai). (Aii) Confocal intravital fluorescence microscopy was performed to follow platelet accumulation and P-selectin expression. Data are mean ± SEM; 46 injuries in 5 WT mice and 42 injuries in 5 GRK6−/− mice. (Aiii) Graph shows the area under CD41 vs time curve (area under the curve [AUC]). (Aiv) Graph shows the area under P-selectin (+) vs time curve (AUC). The line and error bars show the median and interquartile range. (B) CD41+ area at 45 seconds after injury (Bi). (Bii) The rate of CD41 deposition at 45 seconds after injury, and the bar graph represents the average slope of the liner trend line equation of each injury. Forty-one injuries in 5 WT mice and 41 injuries in 5 GRK6−/− mice. (C) Fibrin deposition after making small penetrating injuries in the cremaster muscle arterioles with laser in GRK6−/− mice and littermate controls. Data are mean ± SEM; 24 injuries in 5 WT mice and 25 injuries in 5 GRK6−/− mice (Ci). (Cii) Bar graphs represent the fibrin accumulation at the end of the 3-minute observation period.

