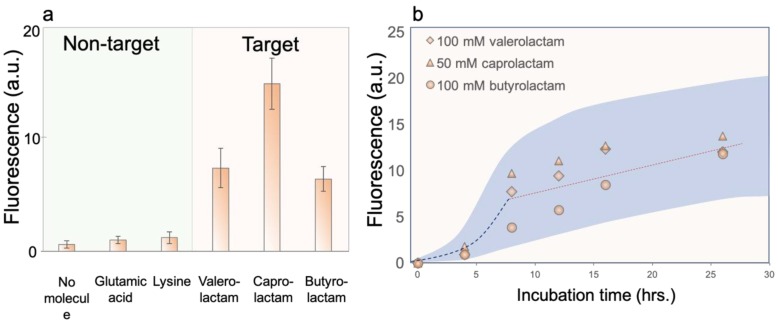
Figure 3.
Biosensor characterization. (a) Biosensor response to non-target and target chemicals. The concentration of all the chemicals are kept to 50 mM. The symbols and error bars refer to the mean and standard deviation of the values from separate microgel sensors (n = 400). (b) Influence of incubation time on the biosensing behavior of different target lactam species. The dash guidelines highlight the exponential and saturation regime, respectively. The shadowed area represents the extent of standard deviation of all data sets.

