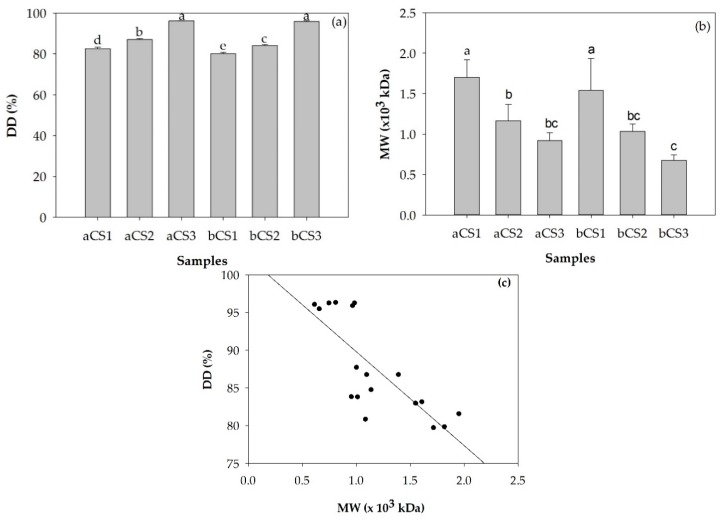
Figure 1.
The degree of deacetylation (%DD) (a) and molecular weight (MW) (b) and Pearson’s correlation coefficient between the %DD and MW (r = −0.779, p < 0.01) of α- and β-chitosan samples with different set of %DD and MW combinations (c). All the data represent the mean with standard deviation (n = 3). Significant differences are indicated by different letters (p < 0.05). Where: a = α-chitosan, b = β-chitosan, CS = chitosan, 1 = low %DD and high MW, 2 = medium %DD and medium MW, 3 = high %DD and low MW.

