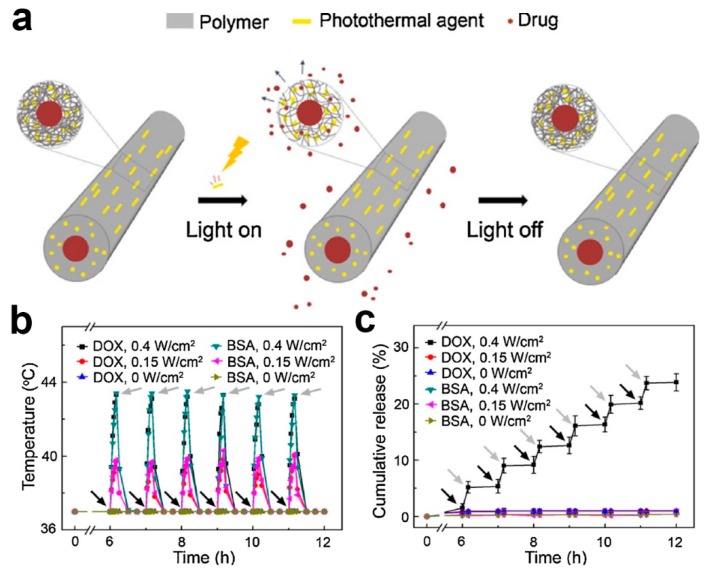
Figure 13.
(a) Schematic diagram illustrating on-demand drug release triggered by NIR light. (b) Temperature curves of PLGA hollow fibers containing DOX and FITC-BSA as a function of time under on–off action of NIR light with varying power density. (c) Cumulative release profiles of DOX and FITC-BSA under on–off switching of NIR light. Black and grey arrow represents the point where NIR light was switched on and off, respectively. Reprinted from work in [118]. Copyright 2019 with permission from Elsevier.

