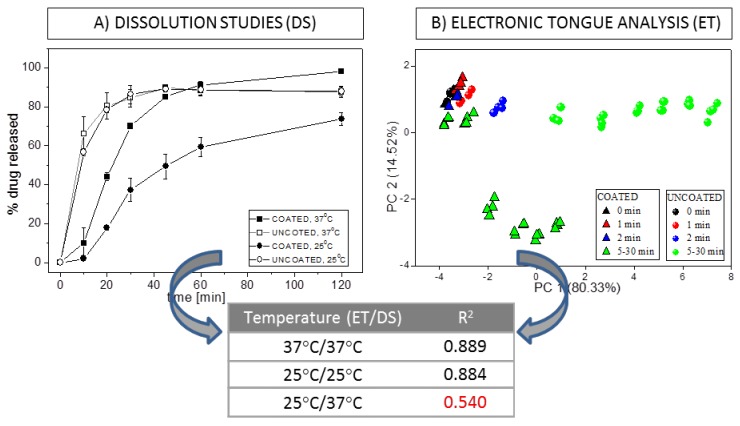
Figure 3.
(A) Dissolution profiles of valsartan minitablets, (B) PCA plot during the release process carried out at 37 °C, and correlation coefficients calculated between the amount of API released during classical dissolution studies conducted at various temperature and distance in PC1–PC2 space. Adapted from [71].

