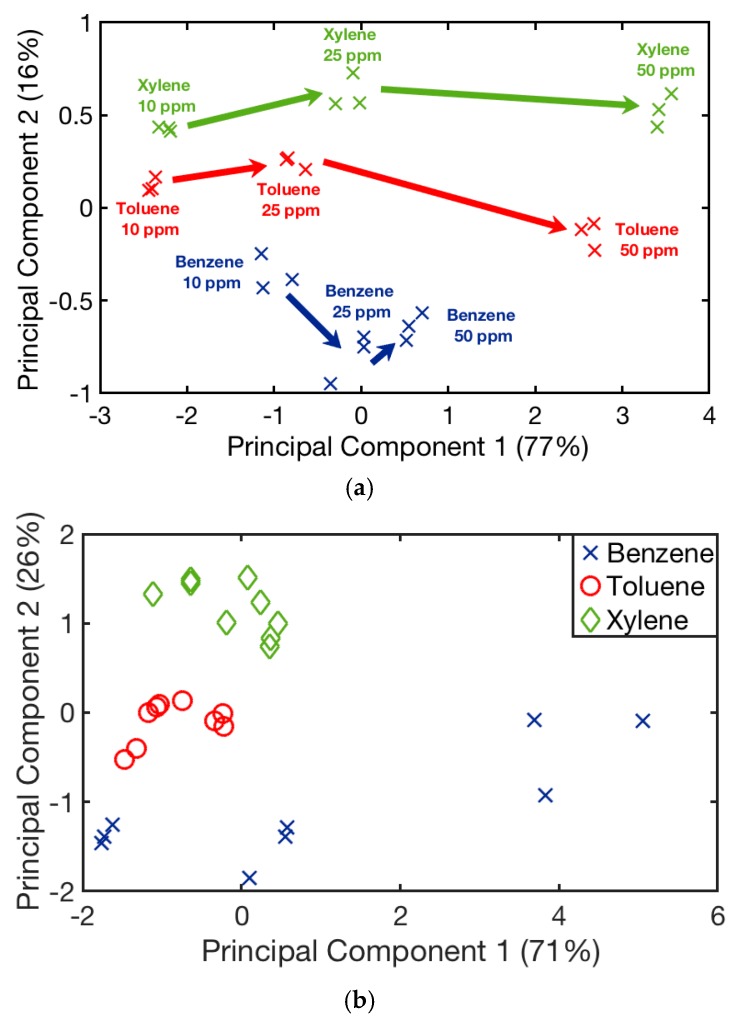
Figure 10.
(a) Principal component analysis applied to data for discrimination of benzene (blue), toluene (red), and xylene (green) at different concentrations. The arrow direction indicates the increase in concentration. (b) Principal components analysis applied to data/concentration for discrimination of benzene (blue), toluene (red), and xylene (green).

