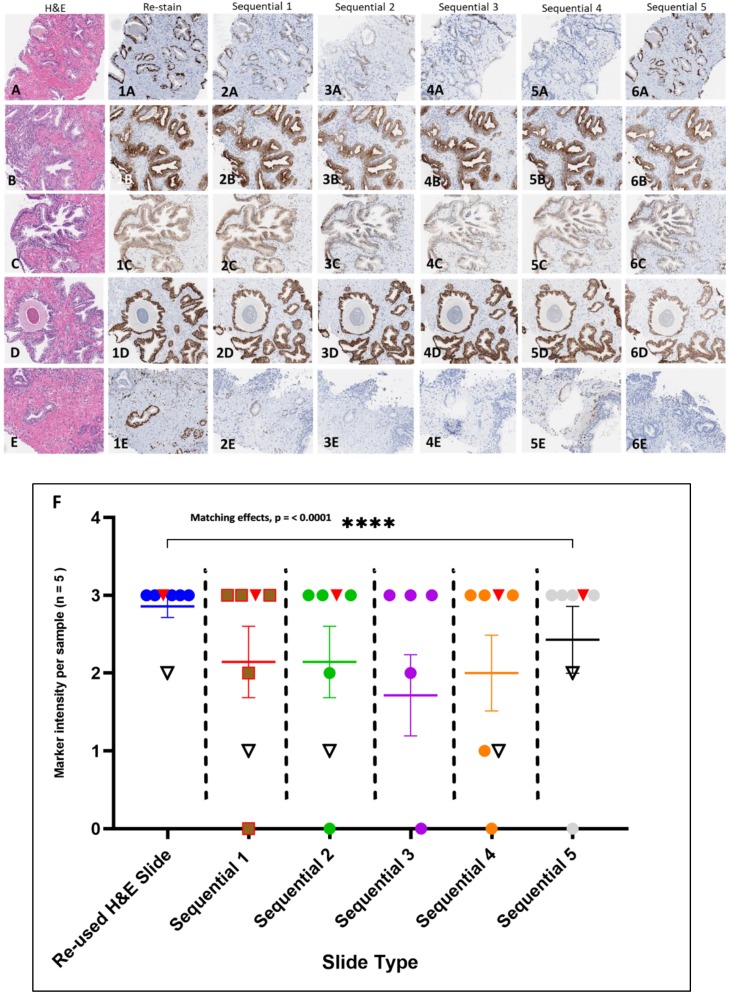
Figure 5.
H&E stained slide image and reused H&E slide selected antibody immunostain comparison with sequential slides in PCa CNBs. (A through 6E). H&E stained Slides (A–E). Antibodies: HMWCK + p63 (1A–5A) (Note: uneven data points for Sequential slide 5 due to lack of immunostain for HMWCK + p63); CK 8 &18 (1B–6B); CD49f (1C–6C); E-cadherin (1D–6D); ERG (1E–6E). Scatter plot assessment of side by side comparison of pathologist analysis scores and comments for sequential slide and reused H&E antibody immunostaining. Note: the red inverted triangles represent the ERG internal controls and the open inverted triangles with black outline represent the CD49f internal controls (F). Data presented as SEM with Chi square, df (18.12, 1). The results determined by RM one-way ANOVA matching across rows (see Table 4) showing significant matching with p value (< 0.0001). The analysis was performed using GraphPad Prism version 8.2.1. [Images 4× magnification].

