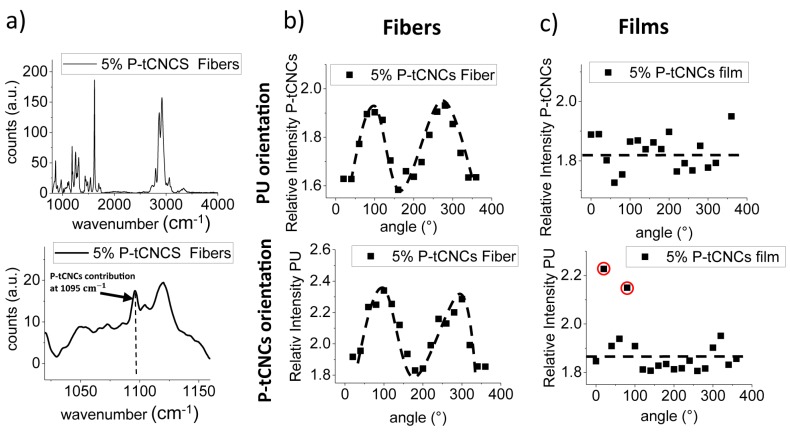
Figure 7.
(a) Raman spectra of 5% P-tCNC containing nanocomposite fibers with the inset showing a zoom into the region of interest, highlighting the CNC contribution at 1095 cm−1. (b) 1D angular Raman plot for 5% P-tCNC nanocomposite fibers, showing the strong angular dependence of the 1095 cm−1 Raman signal. (c) 1D angular Raman plot for 5% P-tCNC nanocomposite films, showing a lack of angular dependence of the Raman signal. Experimental outliers are circled in red.

