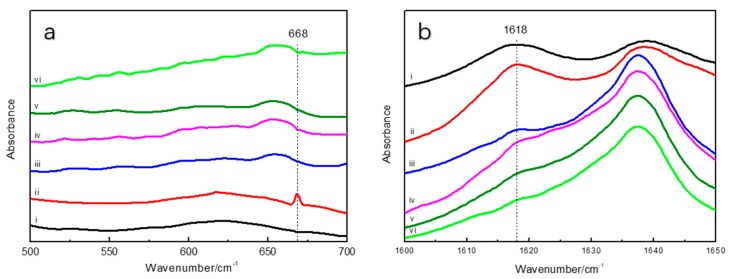
Figure 4.
Fourier transform infrared (FTIR) spectra of silk fibroin (SF), reduced glutathione (GSH)-SF, and samples from 500 cm−1 to 700 cm−1 (a) and from 1600 cm−1 to 1650 cm−1 (b) i. SF, ii. GSH-SF, iii. sample after 30 s UV illumination, iv. sample after 1 min UV illumination, v. sample after 2 min UV illumination, vi. sample after 3 min UV illumination.

