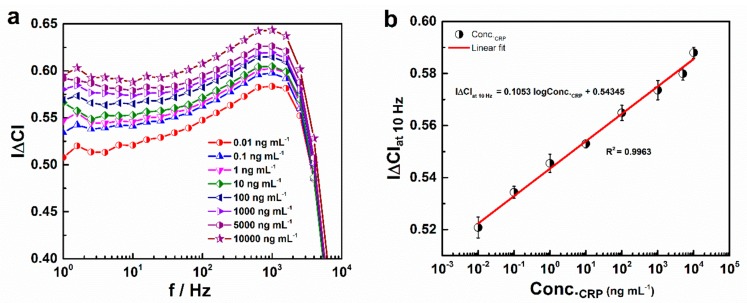
Figure 7.
Normalized capacitance (|∆C|) of the BSA/anti-CRP-antibodies/DTSP/IDWµE array measured with respect to increased CRP concentrations diluted in 1× PBS (a); Calibration plot for |∆C|at 10Hz with increasing CRP concentrations diluted in 1× PBS and ranging from 0.01 to 10,000 ng mL−1 (b). Each data point represents the average of three values (n = 3), with the range indicated by error bars.

