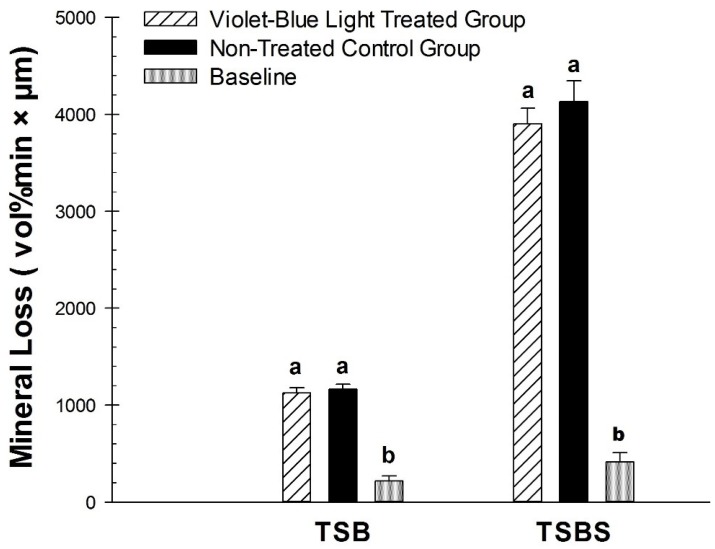
Figure 4.
Comparison of mineral loss (∆Z) in the baseline, violet-blue light treated, and non-treated groups of TSB and TSBS. Treated and non-treated were significantly different for TSB. Comparison of lesion depth (L) in the baseline, violet-blue light treated, and non-treated groups of TSB and TSBS. Different letters represent significant differences between groups within TSB and TSBS, respectively.

