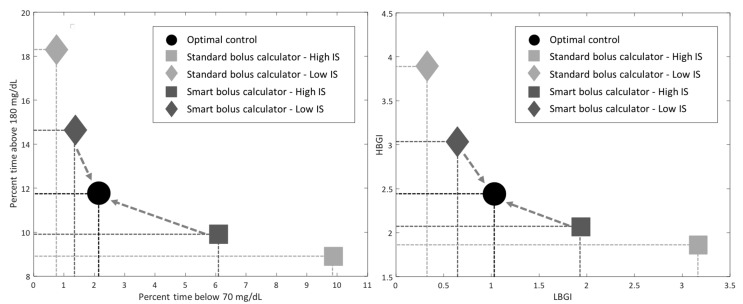
Figure 2.
Study 1 results: Postprandial exposure to hypoglycemia (x-axis) and hyperglycemia (y-axis) obtained with the use of the standard (light gray) and smart (dark gray) bolus calculator in presence of increased (square) and decreased (diamond) insulin sensitivity (IS), as compared to the optimal control achieved in nominal IS conditions (black circle).

