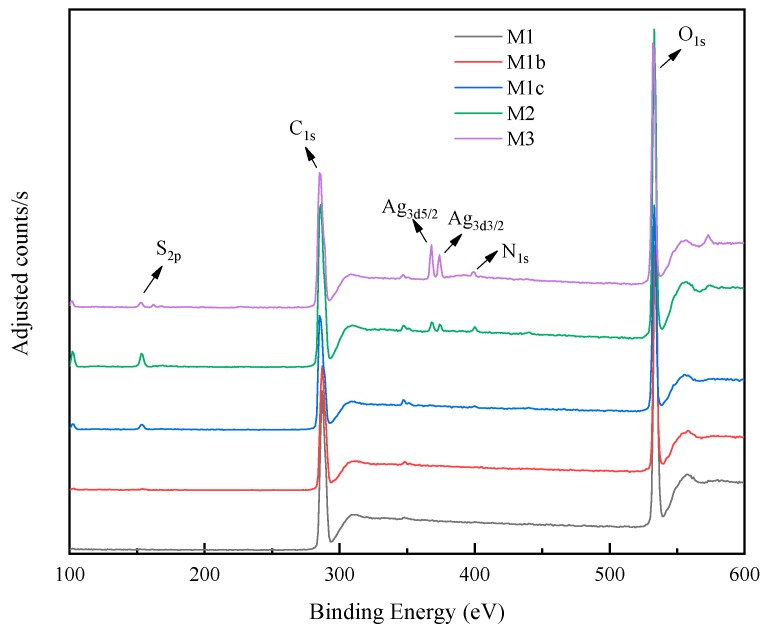
Figure 8.
X-ray photoelectron spectroscopy (XPS) spectra of the membranes: M1 (bottom curve) was the baseline CA membranes showing the presence of only carbon (C) and oxygen (O); M1b (second from the bottom) showing only C and O elements consistent with the structure of CA polyGMA; M1c (third from the bottom, CA with polyGMA-CYS) showing the addition of S; lastly, M2 and M3 (top two curves with the addition of AgNPs) indicating the additional presence of silver.

