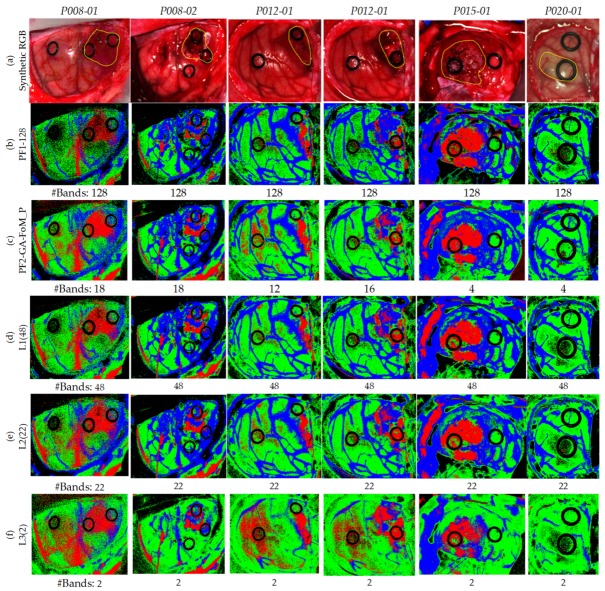
Figure 11.
Maps of the test database using the different coincident levels. (a) Synthetic RGB images with a yellow line identifying the tumor area. (b) Reference results using 128 bands. (c) Results of the PF2-GA-FoM_P using the specific wavelengths identified for each HS test image. (d–f) Results of the PF2-GA-FoM_P in L1, L2 and L3, respectively.

