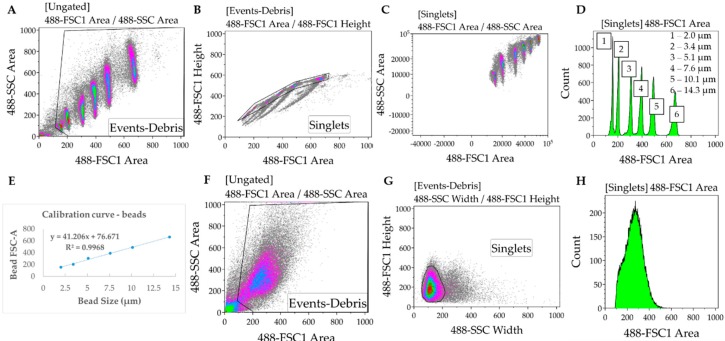
Figure 2.
Protocol for evaluating hypertrophy by flow cytometry. (A–C) Forward (FSC) and side (SSC) scatter values of calibration beads of known sizes are measured, and debris and clumps are excluded by gating. (D,E) Each bead has a distinctive FSC value that is used to plot a calibration curve (FSC vs. size). (F–H) Cardiomyocyte samples are analysed and gated similarly to calibration beads to measure FSC values, which are used to determine cell volume.

