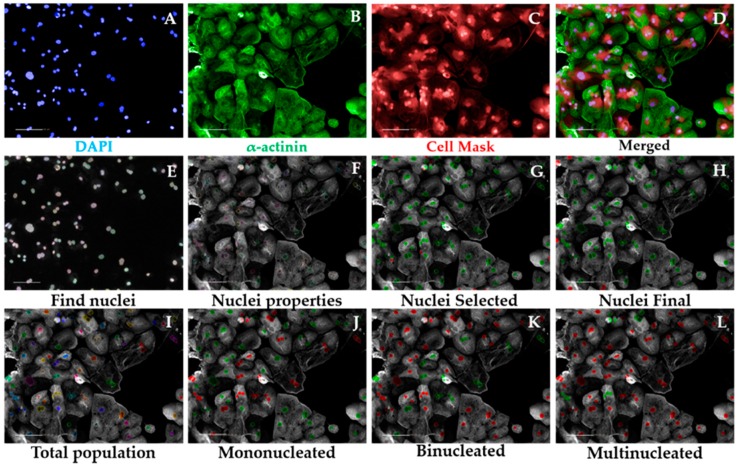
Figure 3.
Multinucleation Analysis Sequence by high-content imaging. Representative micrographs of image analysis of human pluripotent stem cell-derived cardiomyocytes (hPSC-CMs). After inputting the image (A–D), the software excludes debris and cell clumps (E–H) and identifies different degrees of multinucleation based on the distance between nuclei in cardiomyocytes (I–L). Scale bar = 100 μm.

