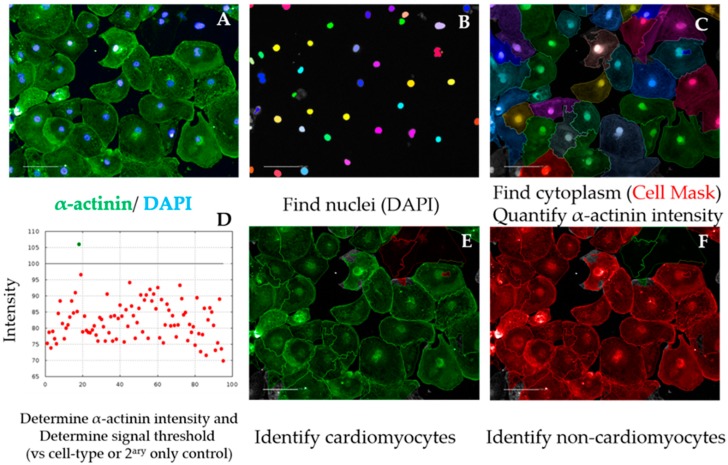
Figure 4.
Cardiomyocyte purity analysis sequence. Representative micrographs of image analysis of hPSC-CMs. After inputting the image (A), the software excludes debris and cell clumps (B) and uses the cell mask staining to define cell cytoplasm (C). The α-actinin signal intensity is quantified in the cytoplasm and a positive signal threshold is determined by comparing with cell-type control (e.g., fibroblasts) (D), enabling the distinction of cardiomyocytes (E) from non-cardiomyocytes (F), required to calculate purity. Scale bar = 100 μm.

