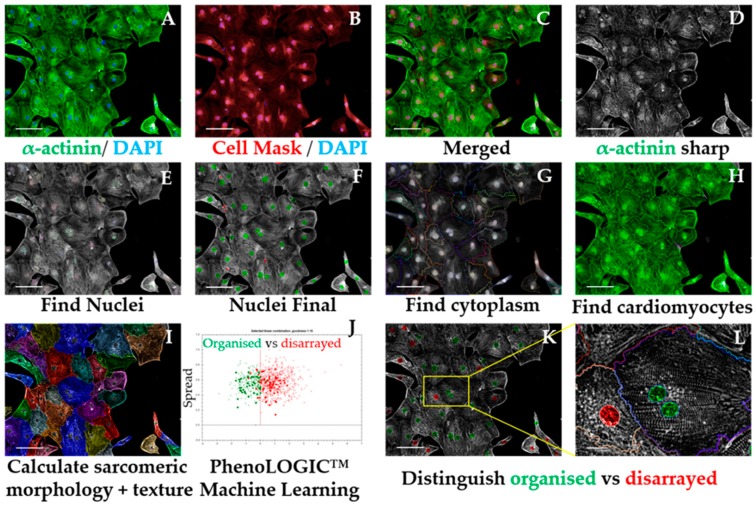
Figure 6.
Sarcomeric disarray analysis sequence. Representative micrographs of image analysis of hPSC-CMs. After inputting the image (A–C), the software uses mathematical transformation algorithms to sharpen sarcomeric signal (D), followed by exclusion of debris and cell clumps (E,F). The cell mask channel is used to define cell cytoplasm (G) and the α-actinin signal intensity is quantified and compared against that of a cell-type control to exclude non-cardiomyocytes from the analysis (H). Morphologic and texture-based information is extracted from the sharpened α-actinin signal displayed by cardiomyocytes (I), followed by a machine-learning procedure where the user manually selects cardiomyocytes displaying organised vs. disarrayed sarcomeres (J). The software then applies this algorithm to the rest of the images being analysed to distinguish organised vs. disarrayed cardiomyocytes (K,L). Scale bar = 100 μm, except for L where it is 20 μm.

