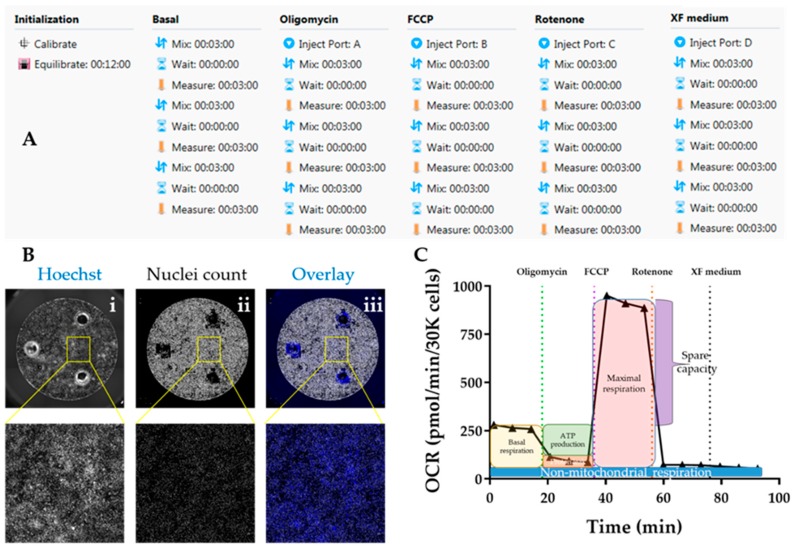
Figure 7.
Evaluation of mitochondrial respiration using Seahorse platform. (A) Protocol summary for mitostress test using the Seahorse assay™. (B) Representative micrographs detailing normalisation by automated quantification of cell nuclei in Cellavista™ plate imager ((i) Hoechst staining of nuclei; (ii) quantification of individual nuclei; (iii) overlay). (C) Sample graph for oxygen consumption rate (OCR) over time following the Seahorse mitostress kit, highlighting the different mitochondrial respiration parameters.

