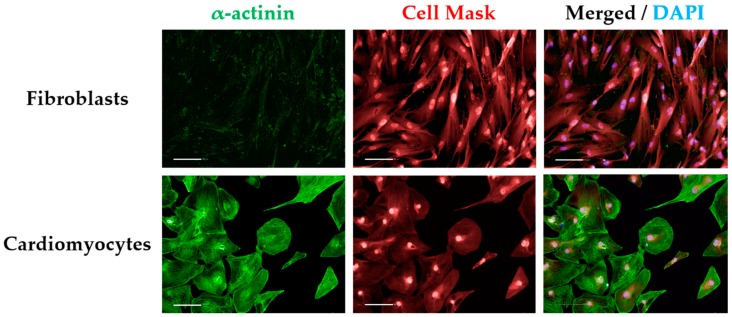
Figure A1.
Cell-type control for α-actinin staining. Comparing signal intensities of α-actinin between fibroblasts or any cell type that does not express the cardiac marker (cell-type control) with cardiomyocytes enables determination of positive signal threshold required for high-content imaging. Scale bar = 100 μm.

