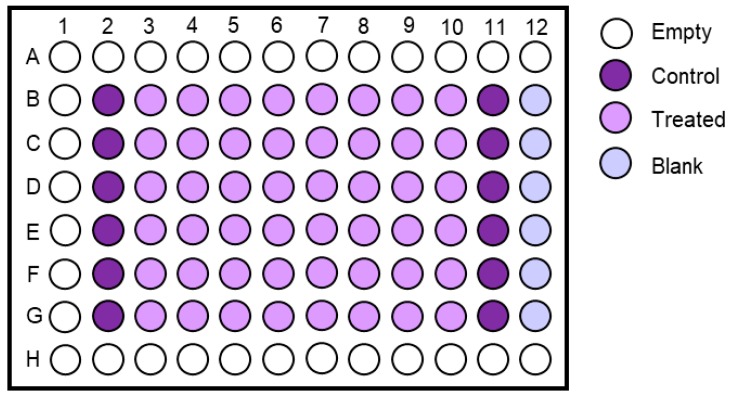
Figure 5.
Example of 96-well plate during crystal violet staining. Columns 2 and 11 represent the controls (darker, as there are more cells), while columns 3–9 show various treatment concentrations (lighter, as there are less cells). Column 12 represents the blank wells, which contain no cells but are stained with Crystal violet.

