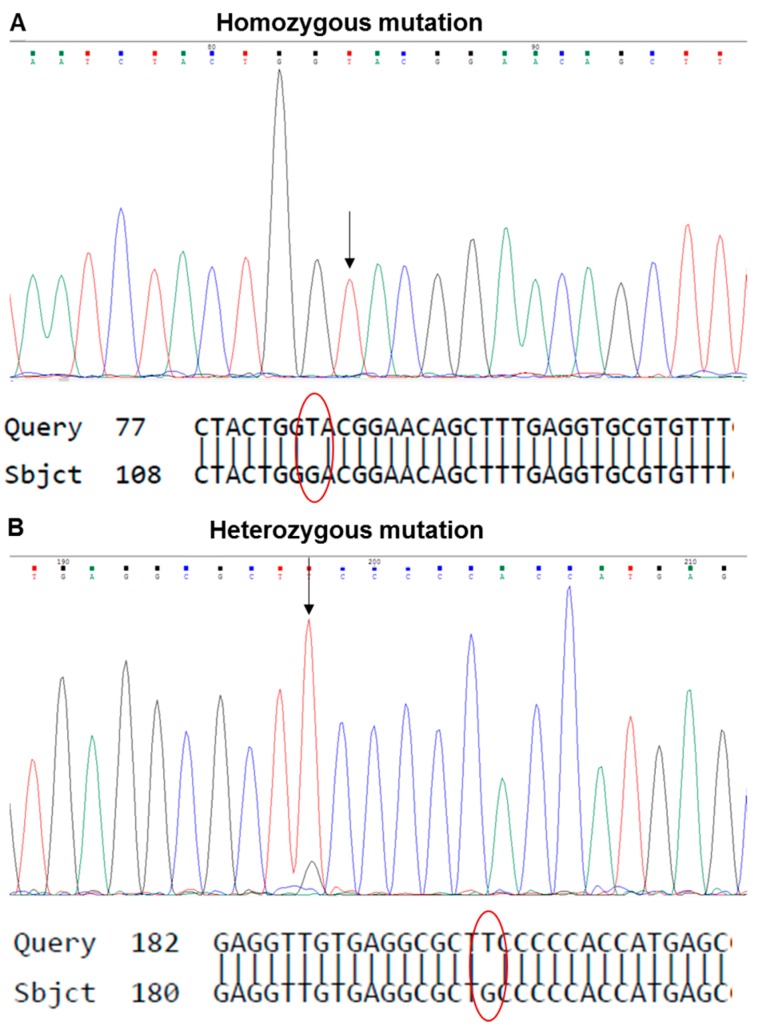
Figure 9.
Example of sequencing chromatograms and aligned sequences. Shown are chromatograms and the sequence of TP53-mutant cultures both containing G:C to T:A transversions. Using the chromatogram, the mutations were identified as (A) homo-hemizygous and (B) heterozygous. The red circle indicates the mutation in the aligned test sequence (query) and the reference sequence (subject).

