
Fig. 3.
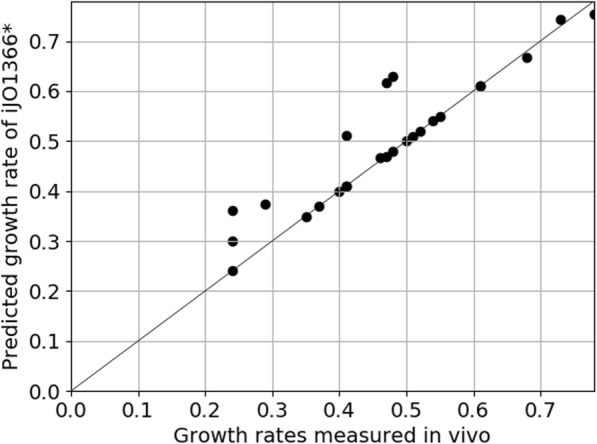
Scatter plot of iJO1366*-predicted and of measured in vivo growth rates for 25 different growth conditions. The in vivo data were taken from [13, 32] as described in the main text; more information can be obtained in Additional file 2. The black diagonal represents the identity function f(x) = x