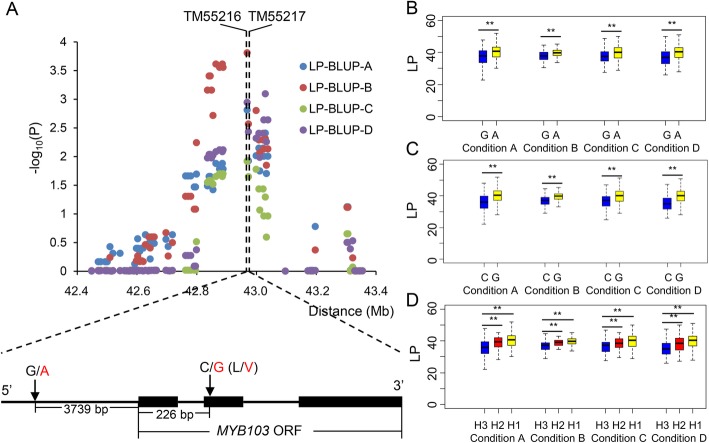
Fig. 4.
Haplotype analysis of the candidate gene MYB103 on chromosome D03. a. Manhattan plots of SNPs around MYB103 for the best linear unbiased prediction (BLUP) of LP across the four different salt conditions and the location of two QTNs related to MYB103. L indicated leucine and V indicated valine. b. Box plots for the phenotypic values of QTN TM55216. c. Box plots for the phenotypic values of QTN TM55217. d. Box plots for the phenotypic values of haplotype from the two QTN combinations. H1 indicated A-G genotype, H2 indicated A-C genotype, and H3 indicated G-C genotype. ** indicated P value at the 0.01 level with student’s t test, respectively

