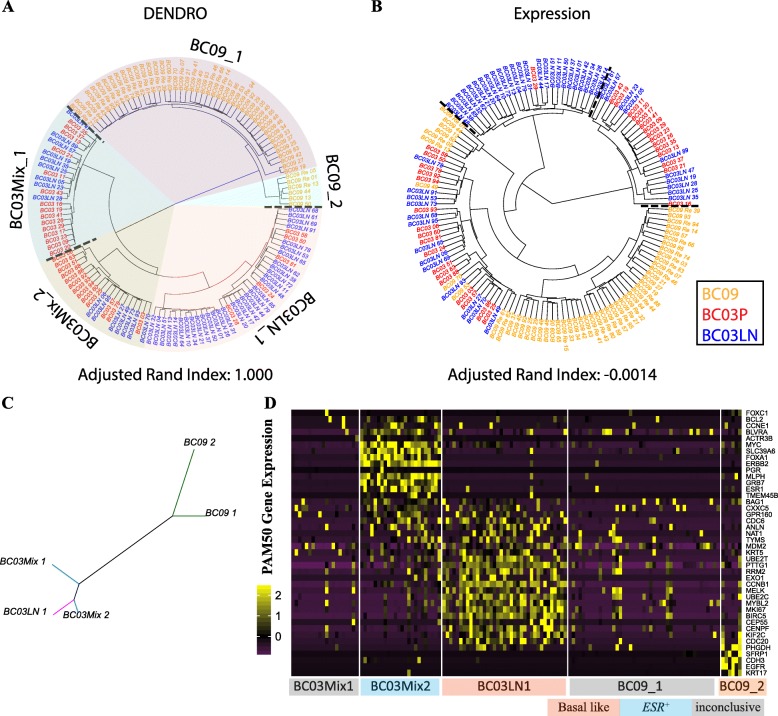
Fig. 4.
Analysis of scRNA-seq dataset of primary breast cancer. a DENDRO cluster result for primary breast cancer dataset (Chung et al. [20]). b Hierarchical clustering result for the same dataset based on expression (logTPM) (dash lines indicate cluster boundaries). c Neighbor-joining phylogenetic tree given detected subclones for breast cancer dataset. d PAM50 gene panel expression shows breast cancer subtypes of each subclone

