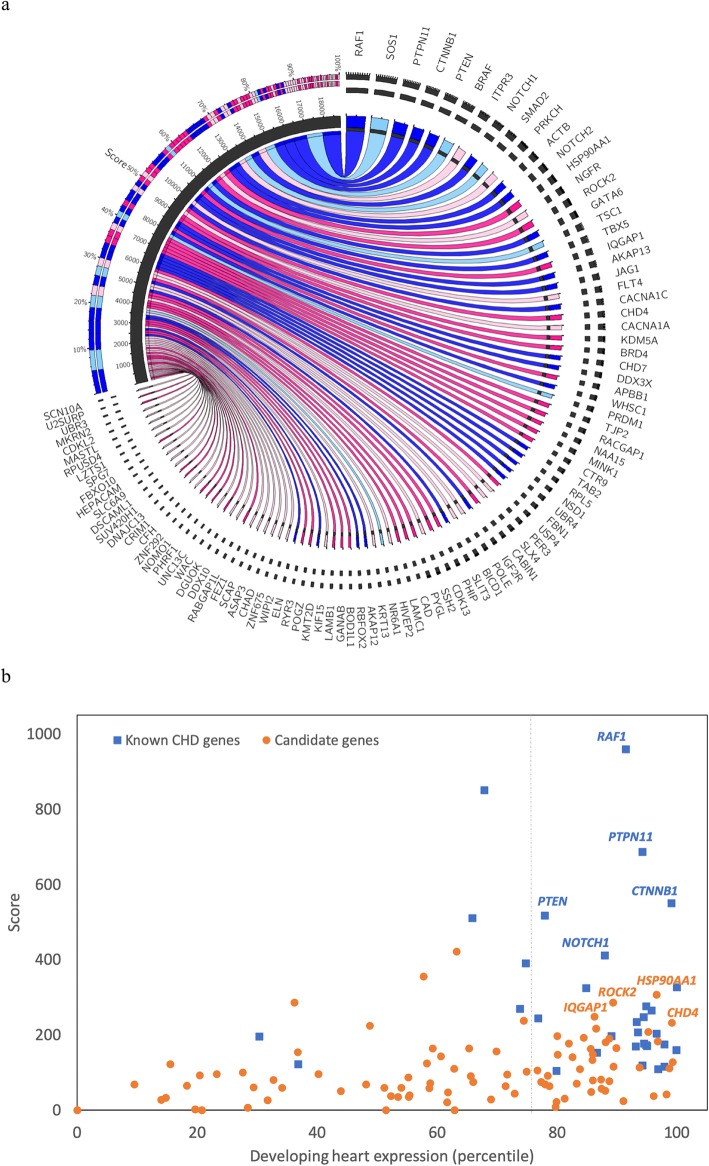
Fig. 5.
Priority score and expression level during heart development of genes in cases. a Circos map illustrating the top 100 genes among 127 filtered genes in cases. The genes are ordered in clockwise direction with respect to the scores. The known CHD-associated genes are indicated by color blue, and the candidate genes are indicated by color pink. Different shades of colors indicate expression level during heart development (darker shade indicates high expression). The inner ring in the score segment represents the score of each gene, and the outer ring represents the relative contribution of each gene’s score to the total score. b All 95 candidate genes and 32 known CHD genes, where the x-axis (0–100) denotes the percentile of heart expression in developing (E14.5) mouse heart, and the y-axis denotes the priority score. The candidate genes are shown in blue squares, and known CHD-causing genes are shown in orange circles. The high scored genes that are in the top 25% of expression in developing heart, HSP90AA1, ROCK2, IQGAP1, and CHD4, are selected as the most plausible gene candidates

