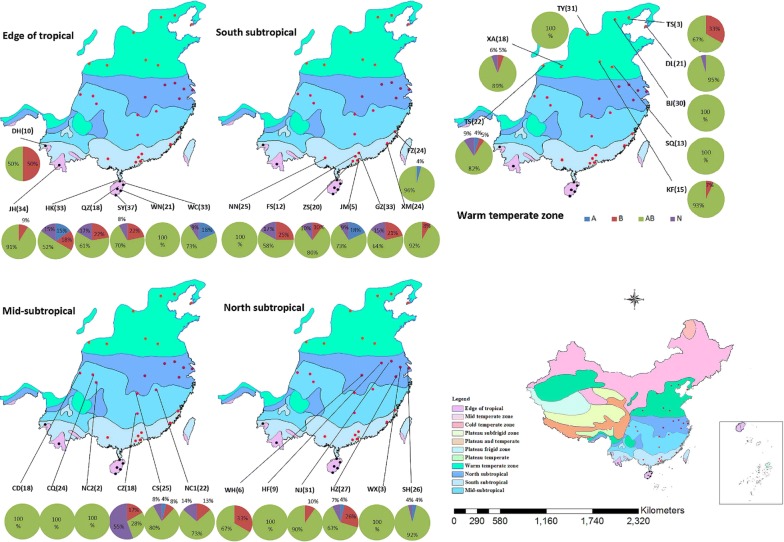
Fig. 2.
Infection rates for different sites in the Edge of tropical, South subtropical, Mid-subtropical, North subtropical and Warm temperate zones. Black, red, pink, purple and brown dots are the sample sites at the edge of Tropical, South subtropical, Mid-subtropical, North subtropical and Warm temperate zones, respectively. Blue square A, rate of single-infected with wAlbA mosquitoes; brown square B, rate of single-infected with wAlbB mosquitoes; green square AB, rate of co-infected with wAlbA and wAlbB mosquitoes; purple square N, rate of Wolbachia-negative mosquitoes

