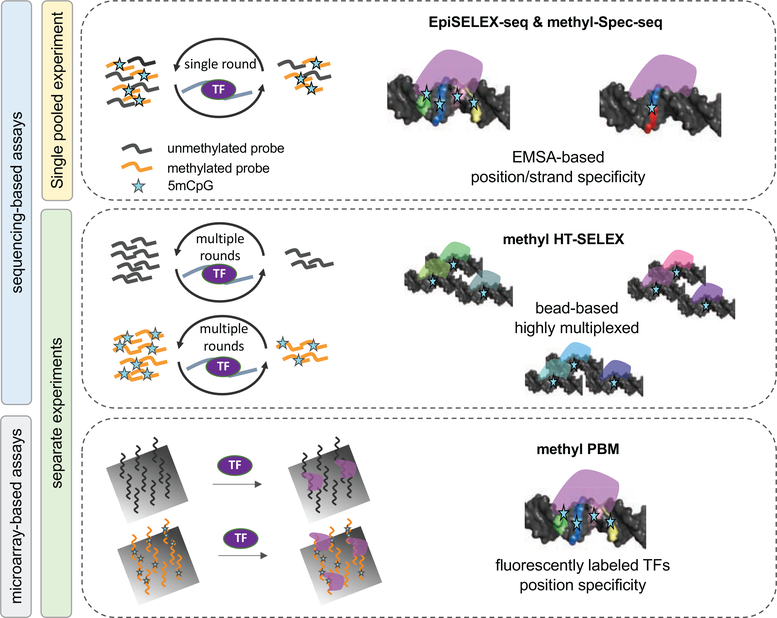
Figure 2: Overview of methods that directly quantify TF binding preferences to methylated DNA in vitro.
Four main assay types are shown, each highlighting important features: Left: EpiSELEX-seq and methyl-Spec-seq both infer quantitative 5mC effect sizes from mixed (barcoded) pools of methylated and unmethylated DNA ligands sequenced after one round of TF binding enrichment. Right: Methyl-HT-SELEX and methyl-PBM estimate 5mC effect sizes by comparing TF binding enrichment scores between unmethylated or methylated DNA ligands. For a detailed description see Table 1.

