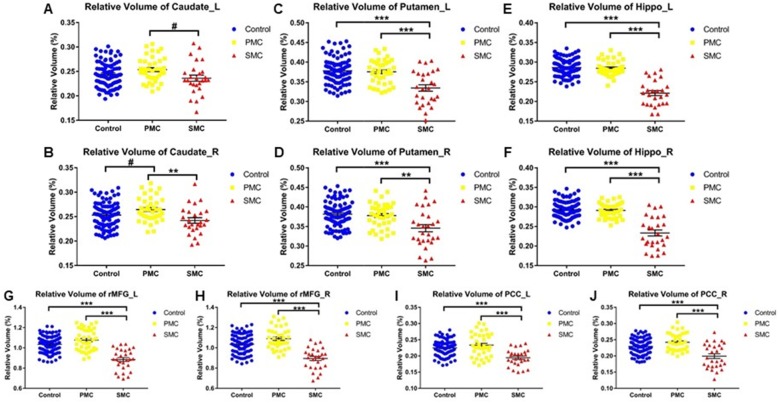
Fig. 2.
Overall group comparison of the ROI volume. a) left caudate, b) right caudate, c) left putamen, d) right putamen, e) left hippocampus, f) right hippocampus, g) left rMFG, h) right rMFG, i) left PCC, j) right PCC. Relative volume of each subject is calculated as the percentage of absolute volume in intracranial volume. The bars indicate mean (SD). rMFG: rostrol middle frontal gyrus; PCC: posterior cingulate cortex; Hippo: hippocampus; L: left; R: right. #0.0167 < P < 0.05, *0.01 < P < 0.0167, **0.001 < P < 0.01, ***P < 0.001

