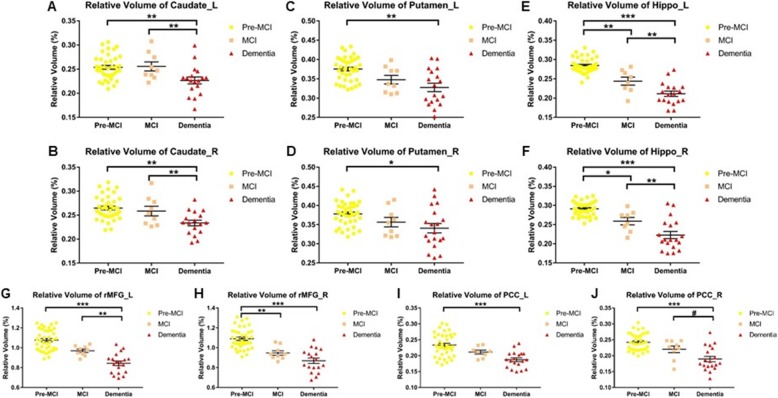
Fig. 6.
Comparison of ROI volume among different stages of mutation carriers. a) left caudate, b) right caudate, c) left putamen, d) right putamen, e) left hippocampus, f) right hippocampus, g) left rMFG, h) right rMFG, i) left PCC, j) right PCC. Pre-MCI represents presymptomatic stage (original PMC group). The bars indicate mean (SD). # 0.0167 < P < 0.05, * 0.01 < P < 0.0167, ** 0.001 < P < 0.01, ***P < 0.001

