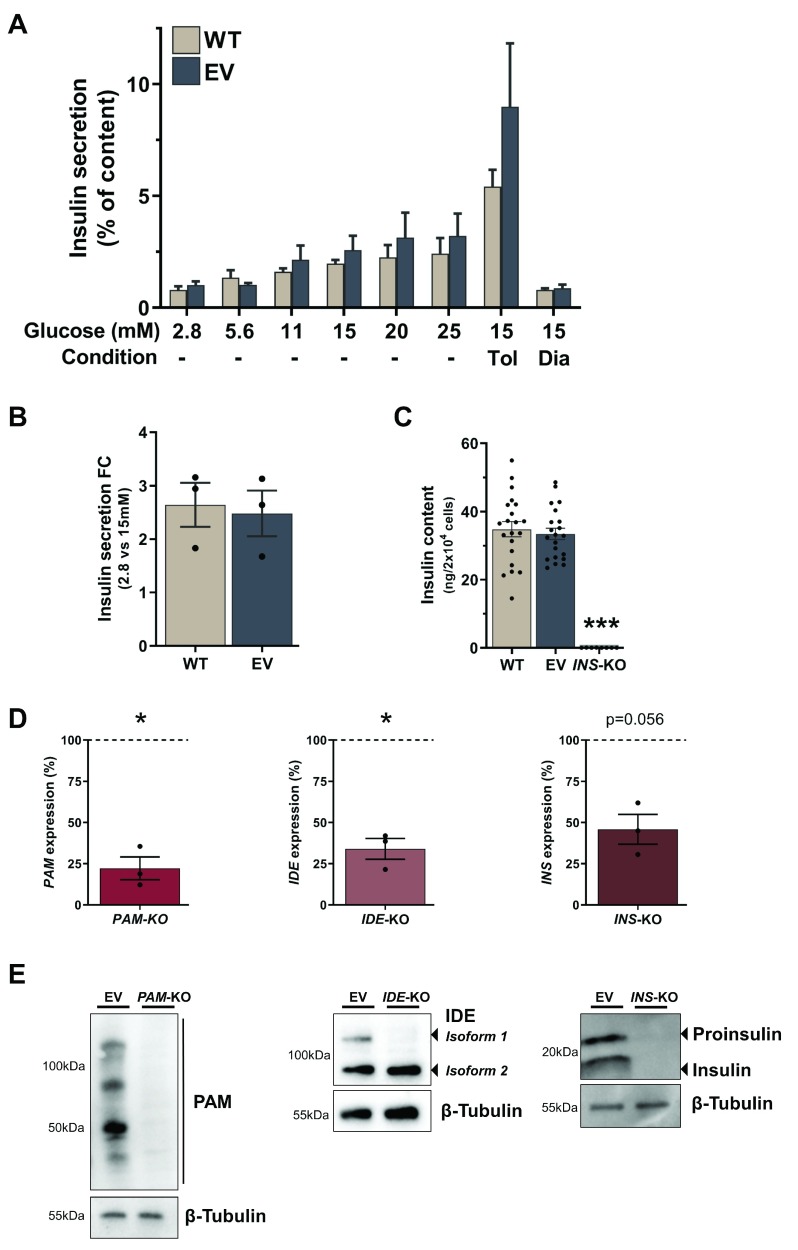
Figure 3. Functional characterisation of EndoC-βH1 KO cell lines.
( A– C) Insulin secretion as percentage of content in different glucose conditions ( A), fold change between 2.8 mM and 15 mM glucose stimulation ( B) and insulin content ( C) in WT cells compared to EV cells. ( D) qPCR expression data for PAM, IDE and INS genes in EV and respective KO cell lines. Values for KO cell lines were normalised to EV within each experiment and fold changes are displayed as percentage of EV, which is indicated as a dotted line at 100%. ( E) Western blot analysis of PAM, IDE and INS in EV and respective KO cells with β-Tubulin as loading control. All data are mean ± SEM from three independent experiments and for insulin content as 21 replicates from seven conditions in three independent experiments. Fold changes were log-transformed for statistical analysis. P values * < 0.05, ** < 0.01 and *** < 0.001 using two-way ANOVA Sidak’s multiple comparison test ( A), two-sample t-test with Holm-Sidak correction for Diazoxide and Tolbutamide induction and glucose stimulation ( A, B), one-way ANOVA with Sidak’s multiple comparison test for insulin content ( C) and one-sample t-test for expression data ( D).

