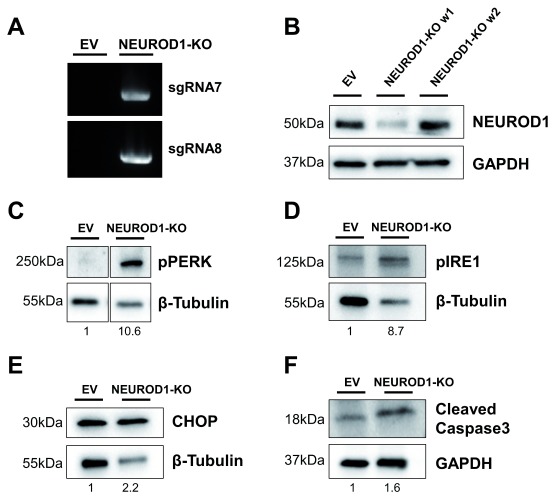
Figure 4. NEUROD1-KO cells demonstrate elevated ER stress and apoptosis.
( A) PCR product for lentiCRISPRv2 and NeuroD1 sgRNA in control EV and NEUROD1-KO cells as described in Figure 2A. ( B) Western Blot analysis for NEUROD1 expression in EV and NEUROD1-KO cells one week apart (w1 and w2). ( C– F) Western blot analysis in EV and NEUROD1-KO (w1) for pPERK ( C), pIRE1 ( D), CHOP ( E) and cleaved caspase 3 ( F). GAPDH or β-Tubulin are indicated as loading controls and data is from one NEUROD1 KO cell line. Values below each lane represent the fold change of protein levels in NEUROD1-KO cells compared to EV cells.

