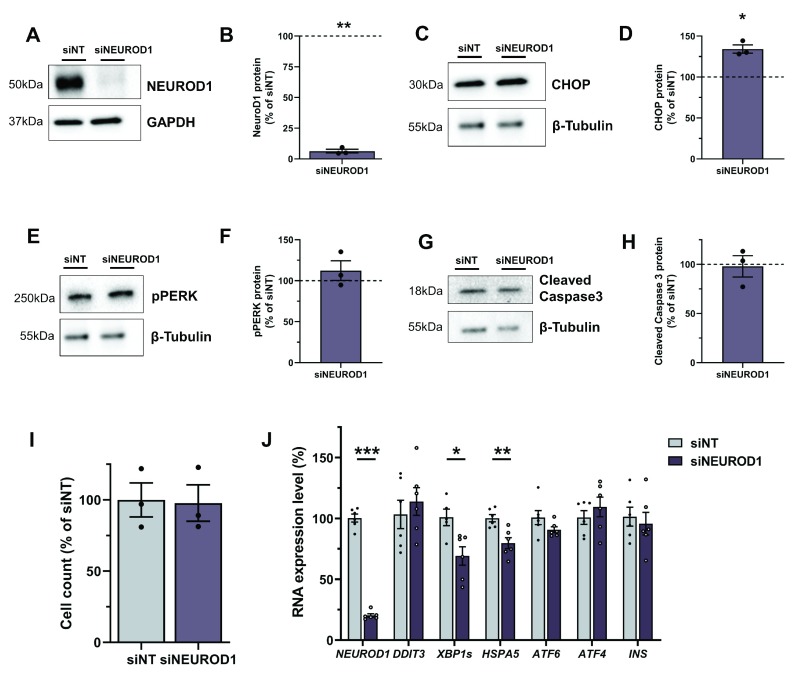
Figure 5. NEUROD1 siRNA silencing results in increased CHOP and chronic ER stress.
( A– H) Western Blot analysis in cells treated with siRNA targeting NEUROD1 (si NEUROD1) compared to control siRNA (siNT). Western blots and quantification for NEUROD1 ( A, B), CHOP ( C, D), pPERK ( E, F) and cleaved caspase 3 ( G, H), β-Tubulin and GAPDH are displayed as loading controls. Protein values were normalised to their respective loading controls and siNT within each experiment and fold changes are displayed as percentage of siNT, which is indicated as a dotted line at 100%. ( I) Cell count data for si NEUROD1 cells is normalised to siNT. ( J) Expression data analysis for genes involved in ER stress in siNT and si NEUROD1 cells. All data are mean ± SEM from three independent experiments for western blots and cell count and six independent experiments for expression data. Fold changes were log-transformed for statistical analysis. P values * < 0.05, ** < 0.01 and *** < 0.001 using one-sample t-test for western blot data ( B, D, F, H) and two-sample t-test for cell count ( I) and expression data ( J).

