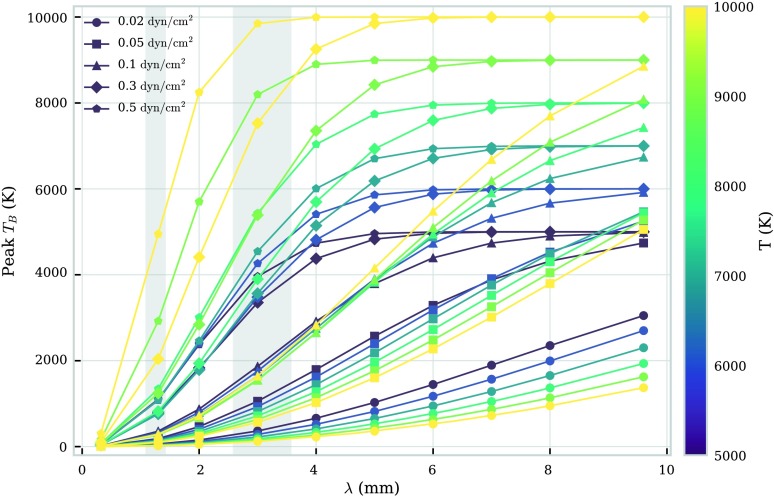
Figure 4.
Relationship between peak brightness temperature and wavelength for a set of isothermal-isobaric fine-structure models. Each colour corresponds to an isothermal temperature (K), as described in the colour bar to the right. Each symbol corresponds to an isobaric pressure (), as described in the legend. The two grey-shaded areas depict ALMA observing Bands 6 and 3.

