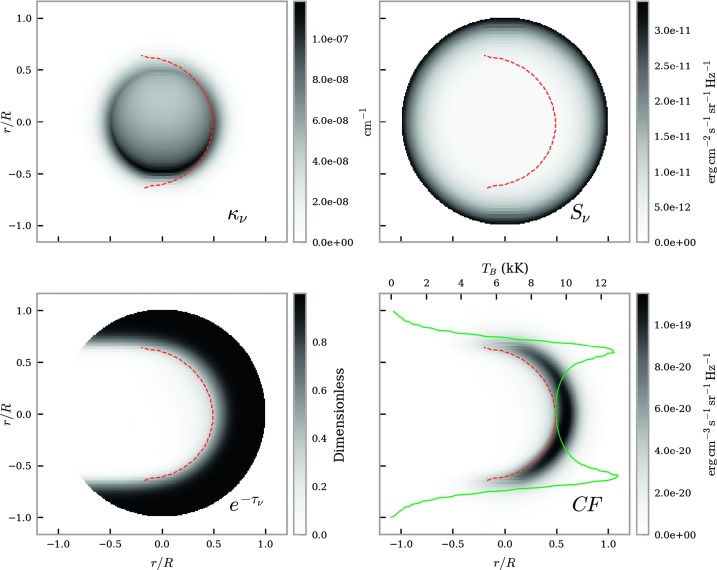
Figure 8.
Brightness temperature FOV for non-isothermal large-scale prominences with gas pressure of at . The top left panel shows a map of the extinction coefficient, the top right panel shows the source function, and the bottom left panel shows the optical thickness attenuation term. The source function here is described by the Planck function. The resulting contribution function map is plotted in the bottom right panel. Integrating over each horizontal LOS results in the brightness temperature (K) curve, solid green line. The dashed red line shows the line.

