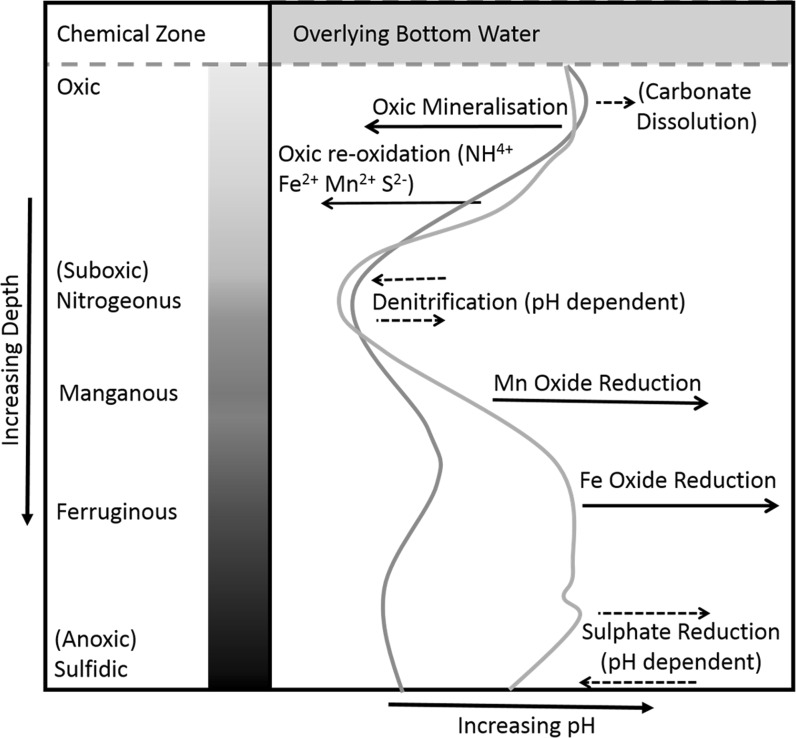
Fig. 1.
Exemplar measured sediment pH profiles (green and orange lines) for diffusive (muddy sand) surficial sediments showing the main chemical processes that drive changes in pH. Those processes that have a strong influence on pH are shown with a solid black arrow, the broken arrows are used to denote those processes that have a weaker, or more uncertain, influence. Chemical zones within the sediment are described using Canfield and Thamdrup (2009). Example profiles were collected in North Sea sediments as part of the Defra Seabed Integrity–ME5301 (Defra 2013) and supported by the UK Ocean Acidification programme and the Cefas Seedcorn programme. (Colour figure online)

