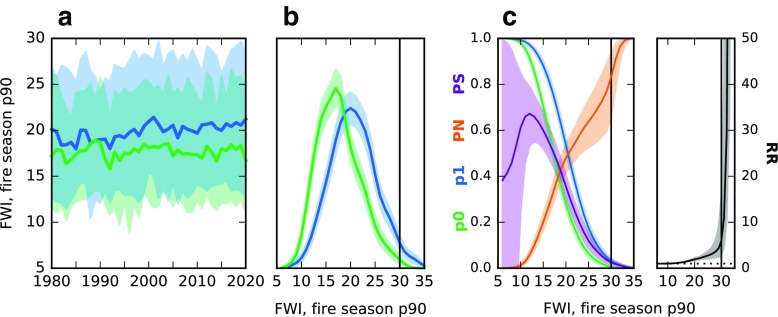
Fig. 3.
a Time series of fire season 90th percentile values of the Fire Weather Index (FWI) for the ALL forcing ensemble mean in blue and NAT forcing ensemble mean in green. Shading represents the 5th–95th percentile range across the ensemble. b Density plots for 2011–2020 for ALL in blue and NAT in green, pooling values from the ensemble members and using a Gaussian kernel density estimator. A non-parametric 90% uncertainty range is shaded, determined through bootstrapping. The vertical bar represents the threshold for an extreme value; for comparison, the Fort McMurray station saw an FWI value of 40 on the day of fire ignition. c Plots of p0, p1, PN, PS, and RR for a fire season 90th percentile value more extreme than the threshold on the horizontal axis. The probabilities (p0 and p1) are determined by empirically integrating the density curves and the shaded uncertainty ranges are a result of the uncertainty on the density curves

