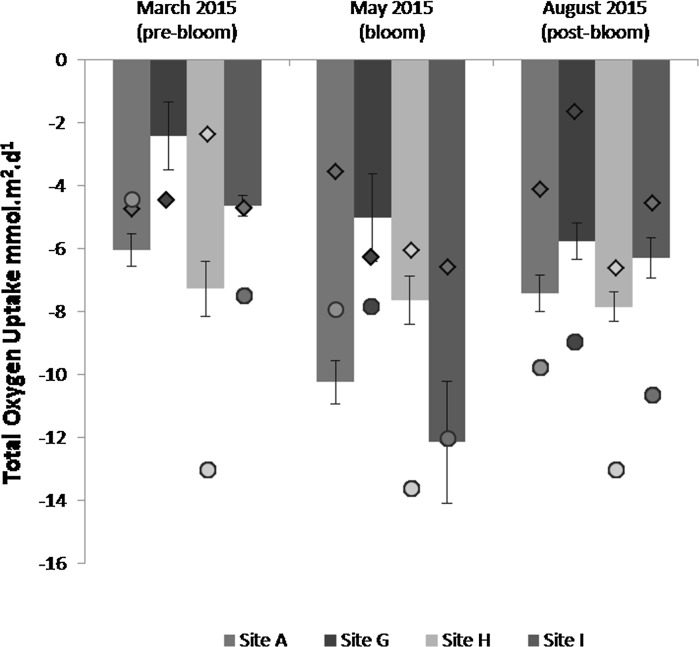
Fig. 2.
Total oxygen uptake rates taken from experiment A (solid bars) for each benthic site for the three 2015 cruises. Closed circles represent total oxygen uptake values from experiment B, diamond symbols represent total oxygen uptake values measured in experiment C. The error bars show the standard error for experiment A

