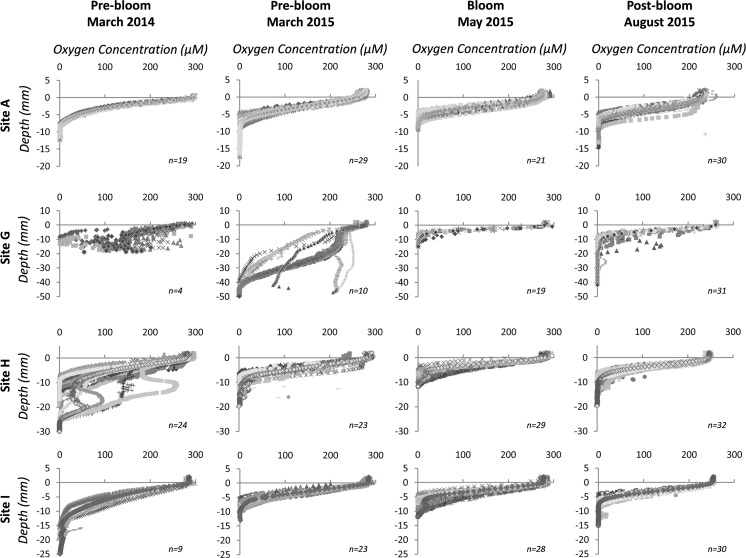
Fig. 8.
Oxygen sediment profiles for each benthic process site from the high-resolution (200 µm increment) measurements. Filled diamonds represent the mean for all fine profiles at each site (blue = site A, red = site G, green = Site H, purple = Site I) for each cruise. Each graph shows the number of profiles (n) per site per cruise, and the average is taken from these. (Colour figure online)

