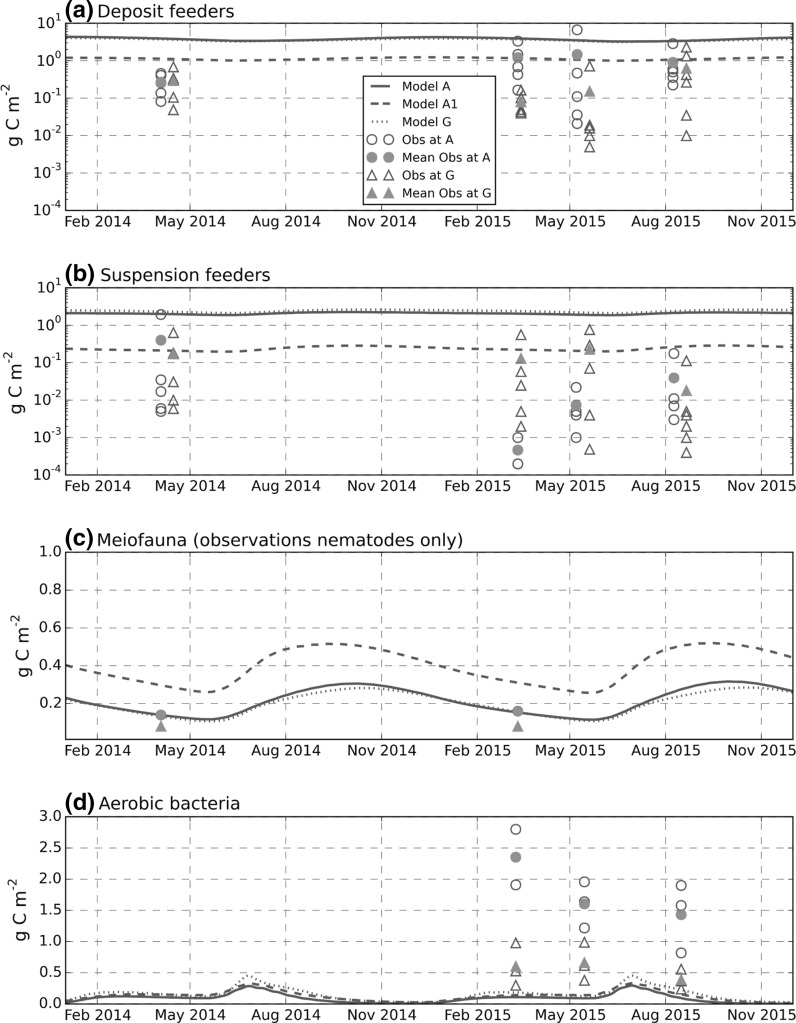
Fig. 10.
Benthic fauna and aerobic bacteria biomass (g C m−2). For the latter, observed values are on the top 1 cm, modelled values are over the oxygenated later depth which is variable in range 0.5–2.0 cm (Fig. 7). Solid line (Model A) site A with original parameter settings; dashed line (Model A1) site A with refractory POM modification; dotted line is model site G with permeable sediment formulation. Observed deposit and suspension feeder biomass shown for all replicates. Average over replicates also plotted (solid symbols). Meiofauna is mean value only (three replicates). Some dates offset (within a 2-week window) to avoid over-plotting of symbols

