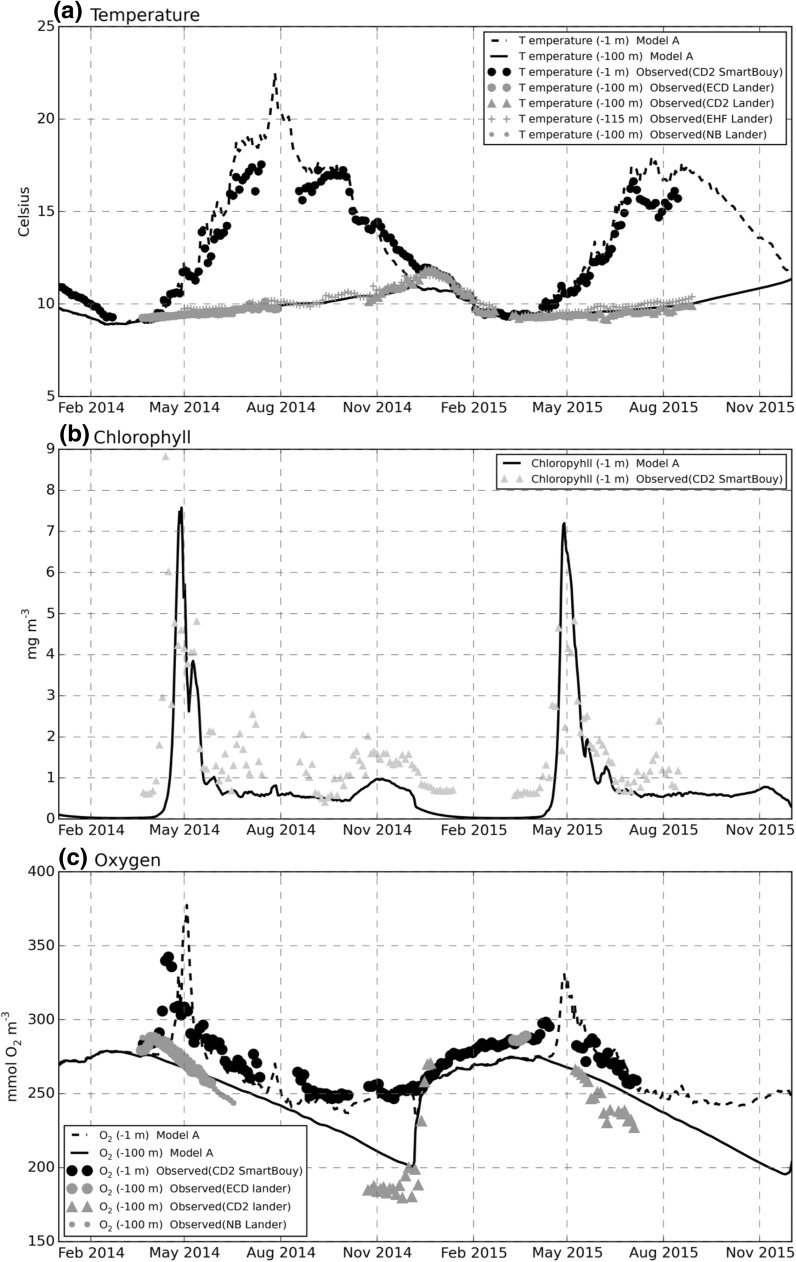
Fig. 5.
Temperature, chlorophyll, oxygen, model-data comparison for pelagic variables near site A. a Temperature (°C), near-surface (−1 m) and near-bottom (−100, −115m). b Surface (−1 m) chlorophyll (mg Chl m−3). c Oxygen concentration (mmol m−3), near-surface (−1 m) and near-bottom (−100 m). Model site G values are almost identical to A and not shown. Surface values from Cefas SmartBuoy. Bottom values from seabed lander deployments. Celtic Deep 2 (CD2); East Celtic Deep (ECD); East Haig Fras (EHF); Nymph Bank (NB). See Fig. 1 for locations

