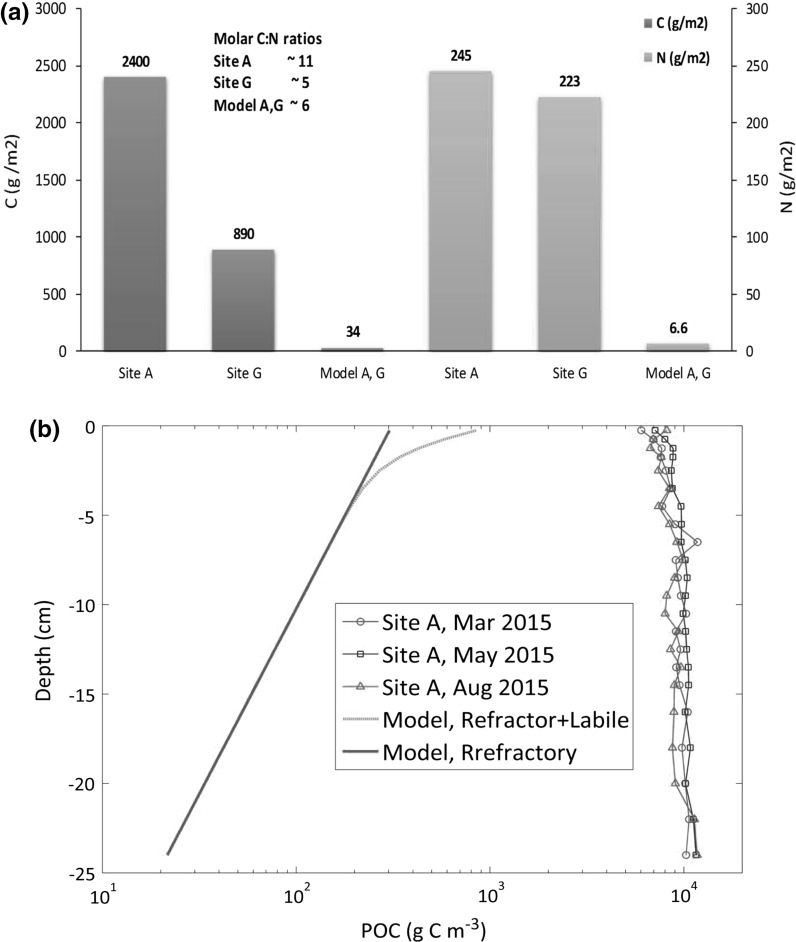
Fig. 6.
Particulate organic carbon and nitrogen model-data comparison. a Total bed inventory (annual average, g C m−2, g N m−2). Observations, 25 cm deep cores at site A and 10 cm deep cores at G, with site G values scaled to 25 cm assuming uniform values with depth. Model values, sum of semi-labile and refractory concentrations integrated down to 25 cm. b POC profiles (g C m−3) at site A. Model curves are annual average values for site A. See "Methods" section and Fig. 2 for definition of refractory and semi labile POM in the model

