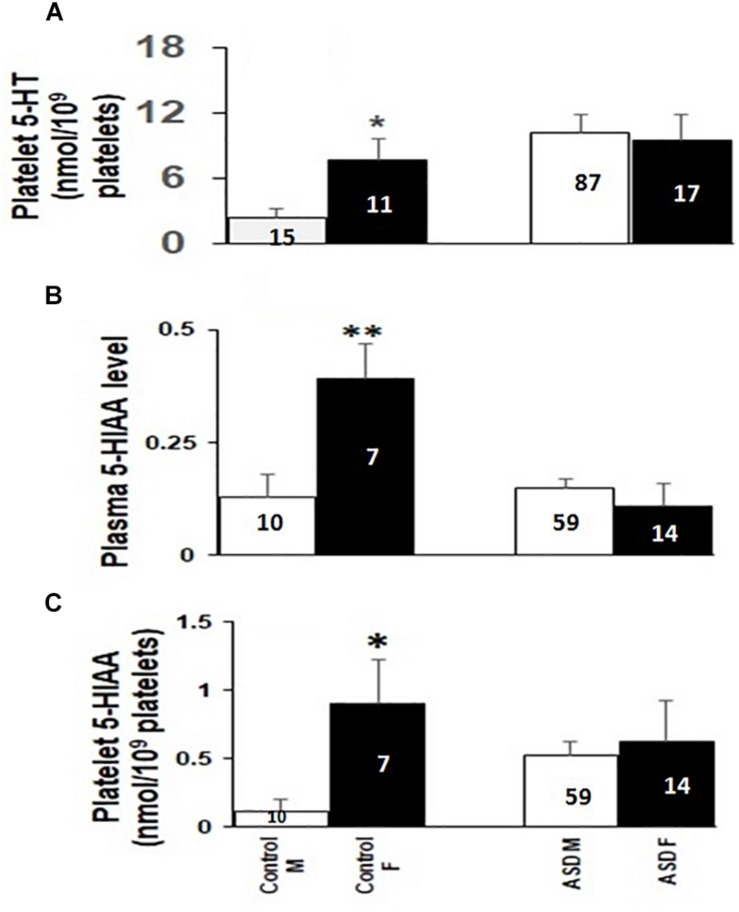
FIGURE 3.
Comparison of platelet 5-HT, plasma and platelet 5-HIAA levels between males and females of ASD cases and controls. The comparative analysis was done using Mann-Whitney U (M-W) test. Panel A represents comparison of platelet 5-HT, Panel B represents comparison of plasma 5-HIAA, and panel C represents comparison of platelet 5-HIAA. M and F represent male and female participants, respectively. Left and right bars denote comparison among controls and cases. The numbers inside the bars depicts the number of samples in each group. ∗ indicates p-value to be ≤ 0.05, ∗∗ indicates p-value to be ≤ 0.009. Power of the analysis is calculated as: for (A) controls: 67%, ASD: 10%; (B) Controls: 67%, ASD: 46%; (C) Controls: 76%, ASD: 66%

