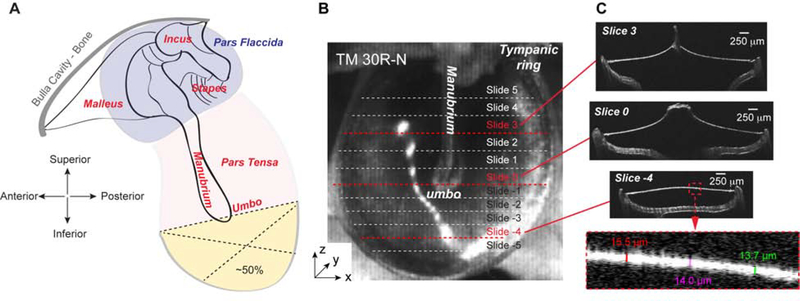
Figure 1. Diagram of TM perforation and thickness measurements using the OCT system.
(A) Diagram of TM perforation. The perforation was introduced at the inferior of the pars tensa to 50% (yellow area) using the umbo as the reference location. (B) 3D scanned OCT image of a normal TM (TM 30R-N). Dotted lines indicate cross sections along which the thickness was measured. (C) Cross-sectional OCT images of three representative locations as indicated by red dashed lines in panel B. These images were taken from locations above, at, and under the umbo, perpendicular to the manubrium. The bottom panel is the zoomed in portion of the Slice −4 to illustrate how the thickness of the TM was measured.

