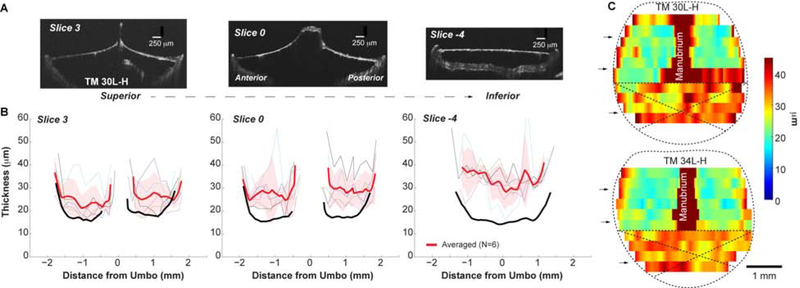
Figure 3. Thicknesses of fresh spontaneously healed TMs post-50%-perforation.
(A) OCT images under fresh conditions of the representative cross-sections of the post-50%-perforation spontaneously healed TM of animal # 30L-H; (B) Thickness reading of the corresponding cross-sections from individual (thin lines) and averaged TMs (thick red line). The thick red line and shaded area stand for the Mean ± SD of 6 TMs. As a comparison, the averaged thicknesses of the normal TMs at the same locations were plotted in black lines (same data as in Fig. 2B). (C) Distribution of the thickness maps of healed TMs post-50%-perforation under fresh condition. Black arrows indicate the locations of the representative slices shown in panel B. Crosses was used to indicate the original perforation area.

