Figure 2.
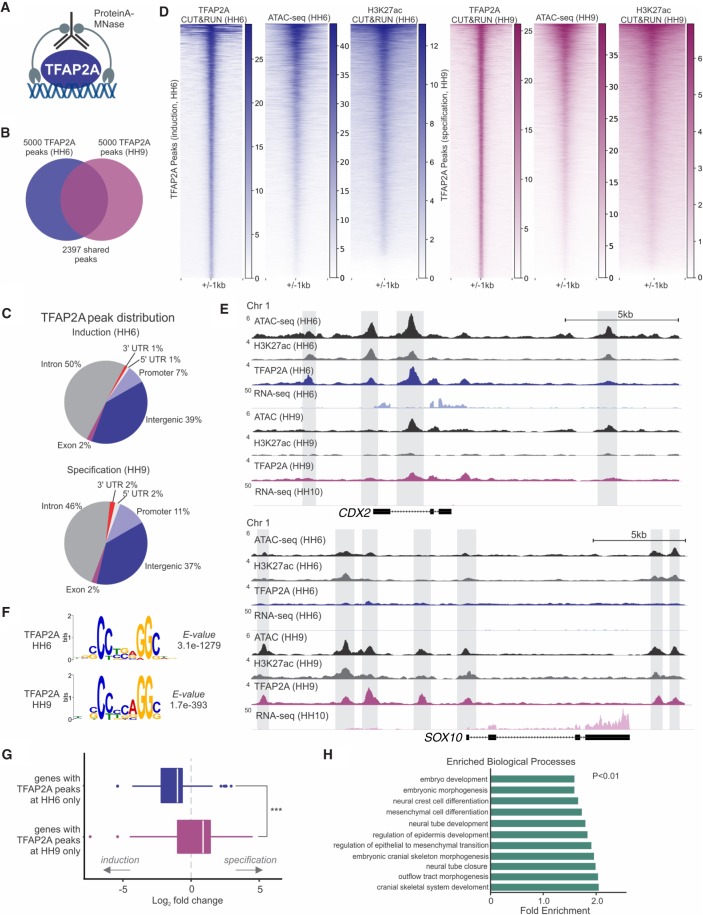
TFAP2A is associated with distinct sets of cis-regulatory elements at sequential steps of neural crest formation. (A) CUT&RUN was used to assess global binding by TFAP2A during induction (HH6) and specification (HH9) in developing chick embryos. (B) Venn diagram of the top 5000 significantly enriched TFAP2A peaks present during induction and specification, 2397 of which are maintained between both developmental time points. (C) Pie charts depicting genomic distribution of TFAP2A peaks at induction (HH6) and specification (HH9). (D) Heatmaps displaying TFAP2A CUT&RUN, ATAC-seq, and H3K27ac CUT&RUN signal at TFAP2A peaks during induction (HH6) and specification (HH9). (E) ATAC, CUT&RUN, and RNA-seq profiles at the loci of the induction gene CDX2 and specification gene SOX10. (F) De novo motif enrichment analysis via MEME-ChIP shows a strong enrichment for the TFAP2A binding motif from both HH6 and HH9 CUT&RUN data sets. Values indicate significance of motif occurrence as reported by MEME. (G) Boxplot displaying the log2 fold change distribution of differentially expressed genes (Padj < 0.1) between HH6 and HH10, which are associated with TFAP2a binding. Genes with HH6-only peaks are enriched during induction, whereas genes with HH9-only peaks are enriched during specification. Significance was assessed via an unpaired two-tailed t-test. (H) Bar plot showing significantly enriched Gene Ontology (GO) terms from GO analysis of genes with annotated TFAP2A peaks (see also Supplemental Table S3). (HH) Hamburger Hamilton; (kb) kilobase. (***) P ≤ 0.001.

